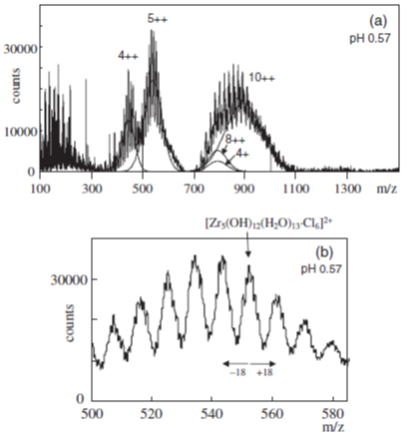
Fig. 2 ESI mass spectra of Zr solution at pHc of 0.57. The overview spectrum
(a) is shown with the solid lines of Gaussian curve fitting. The signs
of i+ and i++ indicate [i-mer]þ and [i-mer]2þ species, respectively. The
peak clusters between m/z ¼ 500{585 and 760–940 are magnified in (b).